 English
 Français
 Deutsch
 Español
 Italiano
 Português

Direct Interaction
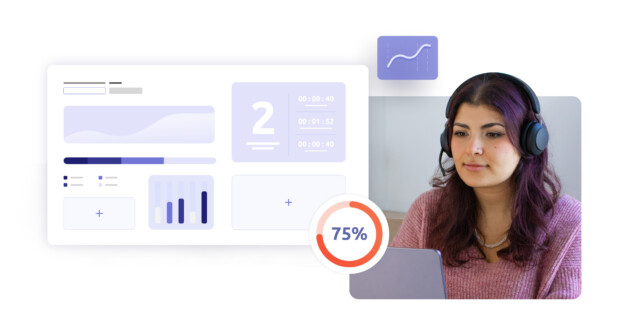
Connect to live calls, whisper guidance, send messages, view agent screens, or take action when needed.
Discover the key statistics that drive better decision-making. From call performance to customer interactions, explore the key figures that help optimize your contact center’s efficiency.

Stay in control of your contact center with real-time key stats. Monitor call center metrics like waiting times and react instantly when needed. For training and quality assurance, supervisors can connect to live calls, provide guidance through whispers or messages, view an agent’s screen, or take action if necessary. These features are fully customizable to match your strategy.

Keep your team informed and ready to act with real-time wallboards. Monitor essential call center metrics—queue status, waiting times, service levels—to detect issues instantly. Customize wallboards to highlight key statistics, setting alerts when values exceed thresholds for better visibility. Ensure smooth operations with clear, actionable insights.

Gain valuable insights into customer behavior with long-term key stats. Understand when and why customers reach out, track trends over time, and optimize your operations accordingly. Use pre-built reports or export data to your BI tool for deeper analysis. Automate report distribution by scheduling recurring deliveries to the right people at the right time. And soon, you’ll have the flexibility to customize reports directly within our interface.
Connect to live calls, whisper guidance, send messages, view agent screens, or take action when needed.
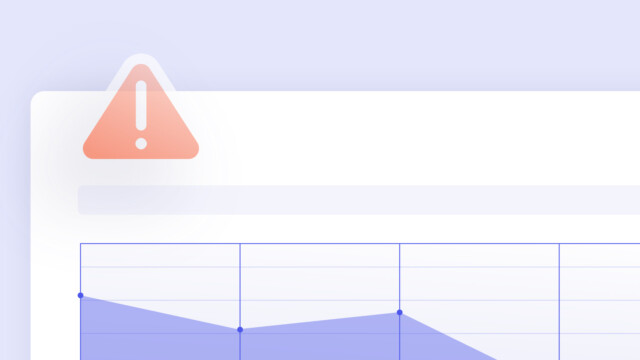
Automatically highlight key figures when KPIs exceed thresholds for better visibility.
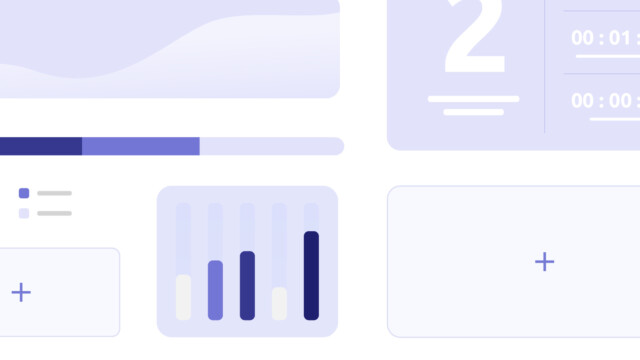
Track long-term call center metrics, peak contact times, and common inquiries via your statistics dashboard.
Productivity
Conversion rate
Quality of service
"Real-time indicators built into Diabolocom’s solution give supervisors a complete view of team performance"
François-Xavier Schepereel
Customer Care DirectorKey statistics—also known as key figures or key stats—are essential metrics that reflect your contact center’s performance. These include data points such as average waiting time, abandonment rate, first-call resolution, agent occupancy, and customer satisfaction. By monitoring these statistics, you gain the insights needed to make smarter decisions, boost productivity, and enhance the customer experience.
The statistics dashboard is designed for a wide range of roles:
Agents who benefit from wallboards displaying live call center metrics, fostering awareness and motivating performance.
Real-time key statistics enable supervisors to act instantly. With features like screen sharing, live call listening, and whisper coaching, supervisors can support agents at the right moment. Alerts and wallboards also ensure that when metrics exceed thresholds, the right people are notified immediately. This leads to:
Our statistics dashboard provides historical reporting that helps you understand customer behavior over time:
These long-term insights allow supervisors and directors to create custom dashboards across chosen periods, helping to refine processes and anticipate future needs.
Wallboards display key figures such as queue lengths, wait times, or service levels in real time. These are typically shown on screens across the contact center floor to:
With customizable alerts, you’ll always know when action is needed to keep performance on track.
Yes. You can:
Coming soon: the ability to customize reports directly within the Diabolocom interface, offering more flexibility and control.
By combining:
Whether you’re on the floor or in the boardroom, the right key statistics are always at your fingertips.