Section 1: What Are KPIs and Why Are They Essential?
A KPI (Key Performance Indicator) is a quantifiable metric used to assess the success of an organization, department, or activity against a predefined objective. In other words, KPIs tell you whether you’re on the right track to achieving your goals.
In a contact center, KPIs measure key factors such as service quality, speed of response, customer satisfaction, agent productivity, and resolution rates.
Tracking KPIs allows you to:
- Evaluate the overall performance of your contact center.
- Identify friction points in the customer journey.
- Pinpoint areas for process and skill improvements.
- Set concrete objectives and track progress.
- Make data-driven decisions instead of relying on intuition.
This is the power of KPIs: they provide tangible insights to help you manage your contact center effectively and continuously improve performance.
More than just metrics, KPIs are powerful management and decision-making tools that drive both operational efficiency and strategic direction.
Two Main Types of KPIs
There are two major categories of Contact Center KPIs:
- Operational KPIs: These track daily performance metrics, such as Average Handle Time (AHT) and First Call Resolution (FCR). Supervisors use these to make real-time adjustments.
- Strategic KPIs: These provide a long-term view of performance aligned with business objectives, such as Customer Satisfaction (CSAT) and Revenue Generated by Customer Service. These are typically used by senior management to guide high-level decision-making.
The key to success is choosing the right KPIs for your dashboards and reports. This process should involve both operational teams and decision-makers to ensure all aspects of contact center performance are covered.
Key Contact Center KPIs to Track
KPI | Definition |
CSAT (Customer Satisfaction Score) | Measures customer satisfaction with the service received during an interaction. |
First Call Resolution (FCR) | Percentage of inquiries resolved during the first interaction without follow-up. |
Average Handle Time (AHT) | The average time an agent spends handling a call, from initiation to resolution. |
Call Abandonment Rate | Percentage of callers who hang up before reaching an agent. |
Customer Churn Rate | Percentage of customers who stop using the company’s services over a given period. |
Average Wait Time | The average time a customer waits before being connected to an agent. |
Customer Call Frequency | The average number of calls made by the same customer within a given period. |
Schedule Adherence | Measures agent punctuality and adherence to planned schedules. |
Agent Utilization Rate | Percentage of an agent’s working time spent on customer interactions. |
Average Speed of Answer (ASA) | The average time it takes for an inbound call to be answered by an agent. |
After-Call Work (ACW) Time | The time an agent spends finalizing a case after ending a call. |
Agent Attrition Rate | Percentage of agents leaving the company within a given period. |
Occupancy Rate | Percentage of an agent’s work time spent actively engaged in calls. |
Total Call Volume | The total number of inbound and outbound calls handled over a given period. |
Service Level | The percentage of calls answered within a predetermined time frame (e.g., 20 or 30 seconds). |
Blocked Call Rate | Percentage of calls that fail to reach the contact center due to insufficient resources. |
Peak Hour Traffic | The volume of calls received during peak hours. |
Forecast Accuracy | The variance between predicted call volume and actual traffic. |
Cost per Call | The cost of handling an individual call, calculated by dividing total expenses by call volume. |
Net Promoter Score (NPS) | Measures customer likelihood to recommend the company on a scale from 0 to 10. |
Call Transfer Rate | Percentage of calls that require a transfer to another department or expert. |
Conversion Rate per Call | Percentage of calls that result in a sale in a sales-driven contact center. |
Agent Engagement Score | Measures agent motivation and involvement in their work. |
Omnichannel Usage Rate | Percentage of customer interactions handled via digital channels (chat, email, social media, etc.). |
Customer Effort Score (CES) | Assesses how much effort a customer must exert to resolve an issue. |
Automation Utilization Rate | Percentage of interactions handled by self-service tools (FAQs, voicebots, etc.). |
Churn Prediction Score | AI-calculated probability of a customer discontinuing their relationship with the company. |
Section 2: Essential Contact Center KPIs for Measuring Performance
There are dozens of Contact Center KPIs to track performance, but we’ll focus here on five of the most commonly used and essential indicators.
First Contact Resolution (FCR)
First Contact Resolution (FCR) measures the percentage of inquiries resolved during the first interaction, without requiring any follow-up.
This KPI is a strong indicator of both service quality (since it reflects how effectively agents can resolve customer needs) and operational efficiency (since resolving an issue on the first attempt requires fewer resources than cases that demand a callback).
A high FCR rate directly impacts both customer satisfaction and operating costs in a positive way.
To improve this metric, consider:
- Optimizing the customer journey upfront—for example, using an IVR system that efficiently routes calls.
- Providing comprehensive agent training to equip them with the knowledge and tools to resolve issues on the first interaction.
Customer Satisfaction Score (CSAT)

The Customer Satisfaction Score (CSAT) is one of the most straightforward Contact Center KPIs for assessing perceived service quality. It is typically measured using a simple survey question such as:
“How satisfied were you with the service you received today?”
Customers respond on a scale from 1 to 5, and the aggregated results provide an overall satisfaction score for a given period.
To maximize the value of CSAT, it’s important to:
- Collect responses consistently, using the most relevant channels (email, SMS, post-call surveys, etc.).
- Analyze dissatisfaction trends to pinpoint specific areas for improvement.
- Segment results by channel, inquiry type, or even individual agents to identify patterns.
Average Handle Time (AHT)
Average Handle Time (AHT) measures the average duration of a customer call, from the moment it is answered to its resolution, including post-call work.
This KPI is crucial for assessing both individual agent efficiency and the contact center’s overall ability to manage call volumes.
However, it’s important not to focus solely on reducing AHT, as this could negatively impact service quality.
The key is to strike a balance between speed and quality by:
- Providing agents with efficient call scripts to guide conversations.
- Ensuring easy access to a centralized knowledge base for quick answers.
- Conducting regular training sessions to improve problem-solving skills.
Call Abandonment Rate
The Call Abandonment Rate tracks the percentage of callers who hang up before reaching an agent. This metric is a critical indicator of accessibility and the contact center’s ability to manage inbound traffic efficiently.
A high abandonment rate suggests a poor customer experience and represents missed opportunities to resolve issues.
To reduce call abandonment, you can:
- Optimize queue management by prioritizing calls based on urgency or skill set.
- Implement smart overflow strategies to redistribute calls when wait times exceed a certain threshold.
Net Promoter Score (NPS)
Net Promoter Score (NPS) measures how likely a customer is to recommend your company to others.
It is calculated based on a single survey question:
“On a scale of 0 to 10, how likely are you to recommend our company to a friend or colleague?”
Customers are then segmented into three categories:
- Detractors (0-6): Unhappy customers who may spread negative feedback.
- Passives (7-8): Satisfied but unenthusiastic customers.
- Promoters (9-10): Loyal customers likely to recommend your brand.
NPS is widely regarded as an excellent indicator of customer loyalty and brand affinity.
In a contact center context, measuring NPS after an interaction provides valuable insight into how well agents turn a simple service request into a positive brand experience.
The Foundation of Contact Center Performance Measurement
These five core KPIs provide a solid foundation for evaluating contact center performance. However, in a rapidly evolving customer service landscape, new metrics are emerging to better reflect the challenges of modern customer experience management.
In the next section, we’ll explore these next-generation KPIs and how they can further optimize contact center operations.
Section 3: The New KPIs for a Modern Contact Center
In the era of omnichannel communication and hyper-personalization, new Contact Center KPIs have emerged to measure performance in ways that align with evolving customer expectations.
Here are four key KPIs that every modern contact center should track:
Call Transfer Rate
As customer inquiries become increasingly complex, it’s not uncommon for an agent to transfer a call to another department or expert for resolution.
While some transfers are necessary, frequent transfers can negatively impact the customer experience. That’s why Call Transfer Rate is a critical KPI to monitor.
A high transfer rate may indicate:
- Insufficient agent training.
- Poor skill-based routing.
- Inadequate knowledge management tools.
To reduce unnecessary transfers, invest in:
- Upskilling your agents to handle a wider range of inquiries.
- Implementing advanced CRM and knowledge-sharing tools to improve agent autonomy.
Call Conversion Rate
This KPI is particularly important for contact centers with a sales focus. It measures how effectively agents convert inbound or outbound calls into actual sales.
Call Conversion Rate is calculated by dividing the number of sales by the total number of calls within a given period. This metric directly reflects the contact center’s role as a revenue driver.
To boost conversion rates, consider:
- Improving lead targeting to focus on high-potential prospects.
- Training agents in effective sales techniques.
- Personalizing sales scripts based on customer profiles.
- Implementing performance-based incentives to keep agents motivated.
Agent Engagement Level
In a contact center, performance is directly tied to agent motivation and engagement.
However, high turnover and absenteeism remain common challenges, negatively impacting both service quality and operational efficiency. That’s why tracking agent engagement is essential.
Engagement levels can be assessed through:
- Anonymous surveys to gauge agent satisfaction.
- Regular one-on-one meetings to identify challenges and areas for improvement.
- Ongoing coaching and training programs, which are powerful tools for maintaining motivation.
Digital and Omnichannel Usage
Today, the phone is no longer the only customer communication channel. Customers increasingly engage with brands through chat, email, social media, and instant messaging.
Measuring the percentage of interactions by channel helps optimize staffing levels and ensure agents are trained for each communication method.

The goal is to provide a seamless and consistent customer experience across all channels. For this, it’s also important to track cross-channel resolution rates, which assess how efficiently customer issues are resolved when switching from one channel to another.
Next-Generation KPIs for a Customer-Centric Contact Center
These four KPIs reflect some of the new priorities in contact center management, including expertise, engagement, omnichannel strategy, and business impact. They allow organizations to optimize performance while keeping the customer experience front and center—without losing sight of operational efficiency.
But to take performance measurement even further, advanced analytics and data-driven KPIs are the next step.
Section 4: Advanced KPIs for Strategic Contact Center Management
With the rise of data analytics and AI, new Contact Center KPIs are emerging to refine and enhance strategic decision-making. These next-generation metrics help organizations better understand and anticipate customer behavior, allowing for a more proactive approach to contact center management.
Here’s a quick overview of key advanced KPIs shaping the future of contact centers.
Customer Effort Score (CES)
The Customer Effort Score (CES) is a valuable complement to traditional satisfaction metrics. While CSAT and NPS measure overall customer sentiment, CES evaluates how much effort a customer must exert to get an issue resolved—a critical factor in customer loyalty.
CES is typically measured immediately after an interaction using a simple survey question such as:
“On a scale of 1 to 5, how easy was it to get your issue resolved?”
A higher score indicates higher friction points, signaling the need for process improvements such as:
- Simplifying the customer journey.
- Empowering agents with better tools and knowledge.
- Streamlining workflows and automation.
The ultimate goal? Minimizing customer effort to enhance satisfaction and reduce churn.
Automation Utilization Rate

Modern contact centers must maximize efficiency by automating low-value tasks, allowing agents to focus on more complex and high-impact interactions.
This is where self-service solutions (AI-powered FAQs, IVRs, voicebots…) come into play. Tracking automation utilization rates helps measure the effectiveness of these tools in handling simple inquiries without human intervention.
Key metrics to monitor include:
- The percentage of interactions handled through automation.
- The resolution rate of automated solutions—ensuring self-service tools actually solve customer issues.
- The rate of end-to-end automated inquiries, which reflects the maturity level of automation within your contact center.
Churn Prediction Score (CPS)
With AI and Big Data, contact centers can go beyond traditional analytics and predict customer churn risk before it happens.
By analyzing multiple data points—such as interaction history, CRM records, and NPS trends—machine learning algorithms can identify customers most likely to leave within a given timeframe.
This probability is represented by an individual Churn Prediction Score (CPS), enabling agents to:
- Personalize customer interactions based on churn risk.
- Proactively offer retention strategies such as targeted offers or enhanced support.
Since retaining an existing customer is up to five times cheaper than acquiring a new one, this metric is particularly valuable. On a broader scale, an aggregated CPS can serve as a KPI for assessing overall customer base stability.
Leveraging Advanced KPIs for a Data-Driven Contact Center
These advanced Contact Center KPIs provide a deeper level of insight into customer interactions, empowering contact centers to optimize performance, reduce churn, and enhance customer satisfaction. By integrating AI-driven analytics, organizations can move toward a predictive and highly efficient customer service model.
As the customer experience landscape continues to evolve, data-driven decision-making will be key to maintaining a competitive edge.
Section 5: A KPI to Measure AI Accuracy in Contact Centers
Beyond traditional Contact Center KPIs, Diabolocom’s R&D team has developed a specific performance metric to assess the accuracy of its automatic transcription and conversation analysis tools: the Word Error Rate (WER).
What is Word Error Rate (WER)?
WER quantifies the number of transcription errors—including substitutions, omissions, and insertions—compared to the total number of words in a transcript. This metric is crucial for evaluating the quality and precision of AI-driven speech-to-text technology.
However, several factors can impact WER, particularly in the complex environment of a contact center:
- Telephony line quality: Audio distortions or compression artifacts from telecom codecs can reduce transcription accuracy.
- Background noise: Common contact center sounds—such as agent conversations, printers, and keyboard typing—can interfere with AI processing.
- Accents and linguistic variations: Regional or non-native accents, as well as diverse phrasing styles, challenge AI models to maintain accuracy.
Optimizing WER for Real-World Contact Center Conditions
To ensure WER reflects real-world performance, it must be trained and measured using authentic customer interactions from actual contact centers.
This is the approach taken by Diabolocom, which fine-tunes its AI transcription models using industry-specific datasets. By training its systems in real acoustic conditions, Diabolocom ensures high transcription accuracy—even in noisy environments.
Section 6: How to Track and Analyze Your Contact Center KPIs Effectively
Tracking Contact Center KPIs isn’t just about collecting data—it’s about analyzing trends over time and using those insights to make strategic improvements.
Here are some best practices to ensure your KPIs drive real business impact.
Use Dynamic Dashboards for Real-Time Monitoring
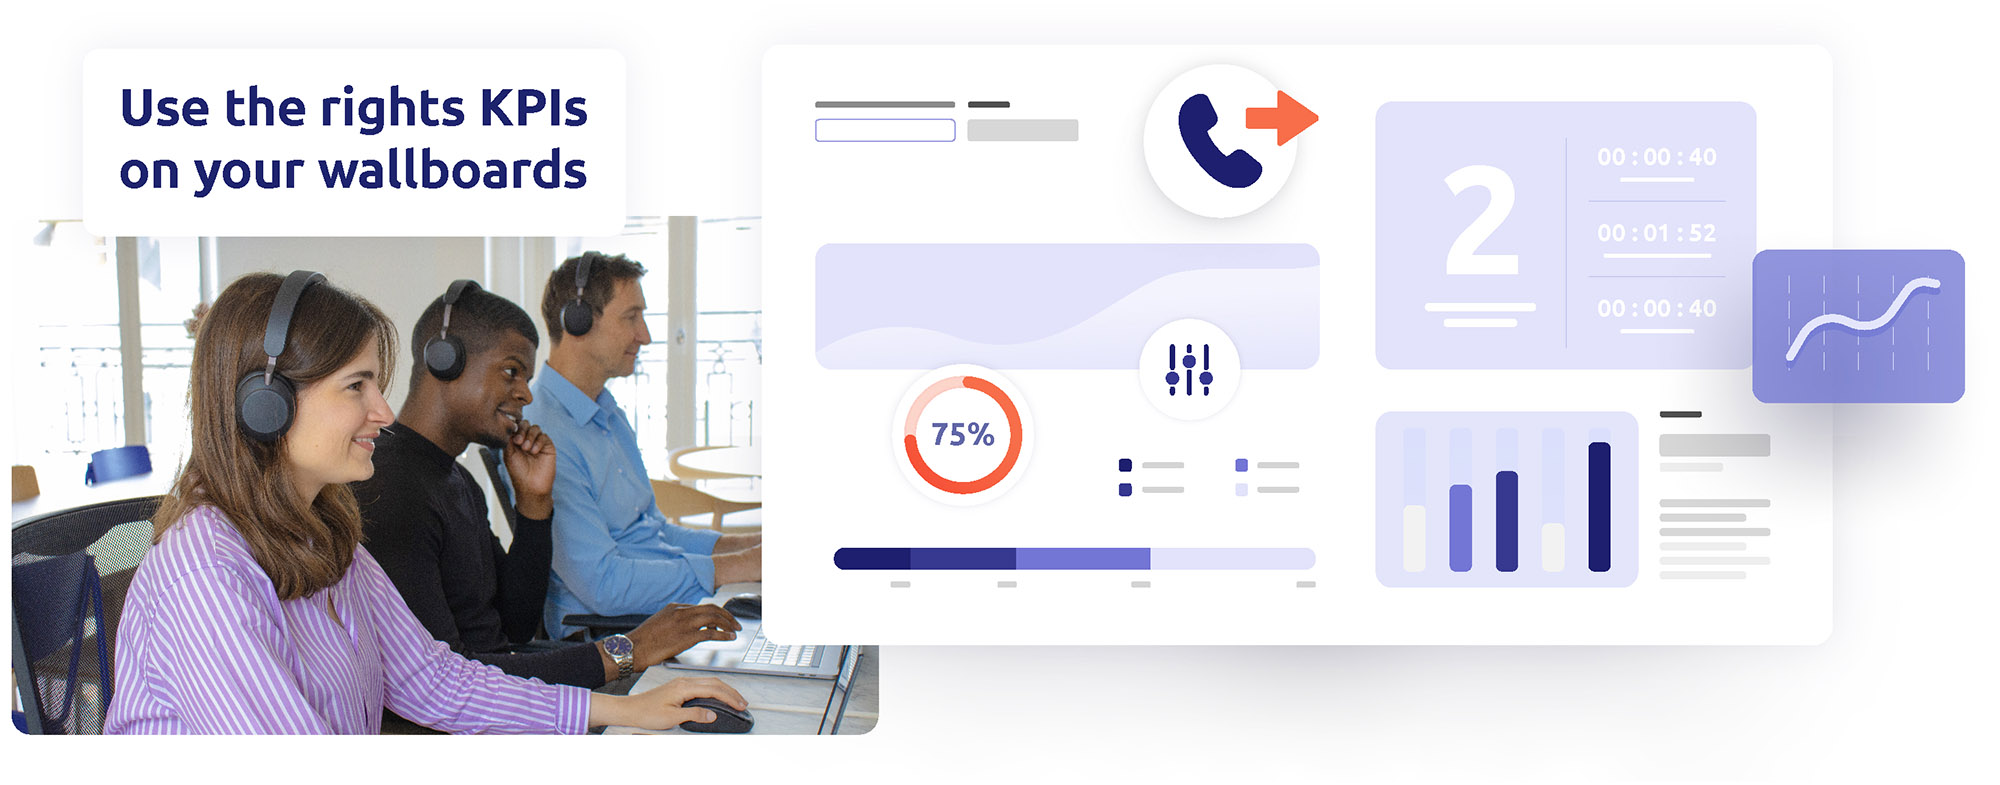
To effectively track KPIs, you need both a high-level overview and a granular breakdown of your operations.
That’s where dynamic dashboards come in. These tools consolidate your key performance indicators in one place, providing real-time visual insights that make data easy to interpret.
Best practice: Opt for real-time, interactive dashboards that allow you to drill down from overall trends to individual metrics.
Many analytics tools are available on the market, but the best ones integrate directly with your contact center solution to provide a 360° view of performance. For example, Diabolocom’s analytics suite transforms raw data into actionable insights with interactive visualizations.
Analyze Trends and Adjust in Real Time
One of the biggest advantages of dynamic dashboards is the ability to track KPI evolution over time.
By analyzing trends, you can:
- Identify early warning signs of potential issues.
- Measure the impact of operational changes and performance optimizations.
Beyond long-term analysis, real-time monitoring is critical. If agent occupancy rate suddenly spikes, you can immediately adjust staffing levels to prevent service degradation.
In this way, KPIs become a key tool for operational agility.
Predictive Insights and Proactive Workforce Planning
Tracking Contact Center KPIs isn’t just about reacting—it’s also about predicting future needs.
By analyzing historical call volume trends, you can forecast seasonal spikes, marketing campaign impacts, and event-driven surges.
With these insights, you can:
- Optimize staffing schedules to match demand fluctuations.
- Ensure service quality while controlling costs.
Advanced Workforce Management (WFM) tools, like those integrated into Diabolocom’s platform, leverage predictive modeling to automate scheduling and continuously adjust workforce allocation.
Conclusion
One thing is clear: KPIs are essential to delivering a high-quality customer experience in a modern contact center.
They provide the insights needed to fine-tune operations and foster a culture of continuous improvement.
However, it’s crucial to track the right KPIs—those that align with your business goals. KPIs are a means to an end, not an end in themselves. The ultimate objective remains customer satisfaction. Avoid the trap of focusing solely on numbers without considering their real impact on customer experience.
Finally, remember that people are at the heart of customer service. While KPIs guide decision-making, it’s your agents who bring the customer experience to life every day. Make sure your dashboards highlight and celebrate agent performance, helping them grow and improve.
Curious to know more about Diabolocom?
